
February 2024 emissions monitoring
The Gloucestershire Energy from Waste Facility has published the emissions monitoring results for operational activity during February 2024.
The emissions levels are set out in the Facility’s Environmental Permit that was issued by the Environment Agency and reflects the emissions limits set out in the Industrial Emissions Directive.
The graph shows the level of permissible emissions according to the Environmental Permit, shown by the yellow line. The actual emissions produced by the Facility are shown in green as a percentage average output over the month. For this month, all emissions produced are below the permitted limit set by the Environment Agency and our Permit.

January 2024 emissions monitoring
The Gloucestershire Energy from Waste Facility has published the emissions monitoring results for operational activity during January 2024.
The emissions levels are set out in the Facility’s Environmental Permit that was issued by the Environment Agency and reflects the emissions limits set out in the Industrial Emissions Directive.
The graph shows the level of permissible emissions according to the Environmental Permit, shown by the yellow line. The actual emissions produced by the Facility are shown in green as a percentage average output over the month. For this month, all emissions produced are below the permitted limit set by the Environment Agency and our Permit.

December 2023 emissions monitoring
The Gloucestershire Energy from Waste Facility has published the emissions monitoring results for operational activity during December 2023.
The emissions levels are set out in the Facility’s Environmental Permit that was issued by the Environment Agency and reflects the emissions limits set out in the Industrial Emissions Directive.*
The graph shows the level of permissible emissions according to the Environmental Permit, shown by the yellow line. The actual emissions produced by the Facility are shown in green as a percentage average output over the month. For this month, all emissions produced are below the permitted limit set by the Environment Agency and our Permit.
* The Facility has always measured and reported ammonia emissions, however, following the recommendations set out in the Best Available Techniques (BAT) Reference Document (BREF) for Waste Incineration published in 2019, the Environment Agency has introduced a daily average emission limit for ammonia which came into effect on 3rd December 2023. Consequently, ammonia emissions for the Facility will be reported as part of all future emissions monitoring results.

November 2023 emissions monitoring
The Gloucestershire Energy from Waste Facility has published the emissions monitoring results for operational activity during November 2023.
The emissions levels are set out in the facility’s Environmental Permit that was issued by the Environment Agency and reflects the emissions limits set out in the Industrial Emissions Directive.
The graph shows the level of permissible emissions according to the Environmental Permit, shown by the yellow line. The actual emissions produced by the facility are shown in green as a percentage average output over the month. For this month, all emissions produced are below the permitted limit set by the Environment Agency and our Permit.

October 2023 emissions monitoring
The Gloucestershire Energy from Waste Facility has published the emissions monitoring results for operational activity during October 2023.
The emissions levels are set out in the facility’s Environmental Permit that was issued by the Environment Agency and reflects the emissions limits set out in the Industrial Emissions Directive.
The graph shows the level of permissible emissions according to the Environmental Permit, shown by the yellow line. The actual emissions produced by the facility are shown in green as a percentage average output over the month. For this month, all emissions produced are below the permitted limit set by the Environment Agency and our Permit.

September 2023 emissions monitoring
The Gloucestershire Energy from Waste Facility has published the emissions monitoring results for operational activity during September 2023.
The emissions levels are set out in the facility’s Environmental Permit that was issued by the Environment Agency and reflects the emissions limits set out in the Industrial Emissions Directive.
The graph shows the level of permissible emissions according to the Environmental Permit, shown by the yellow line. The actual emissions produced by the facility are shown in green as a percentage average output over the month. For this month, all emissions produced are below the permitted limit set by the Environment Agency and our Permit.

August 2023 emissions monitoring
The Gloucestershire Energy from Waste Facility has published the emissions monitoring results for operational activity during August 2023.
The emissions levels are set out in the facility’s Environmental Permit that was issued by the Environment Agency and reflects the emissions limits set out in the Industrial Emissions Directive.
The graph shows the level of permissible emissions according to the Environmental Permit, shown by the yellow line. The actual emissions produced by the facility are shown in green as a percentage average output over the month. For this month, all emissions produced are below the permitted limit set by the Environment Agency and our Permit.

July 2023 emissions monitoring
The Gloucestershire Energy from Waste Facility has published the emissions monitoring results for operational activity during July 2023.
The emissions levels are set out in the facility’s Environmental Permit that was issued by the Environment Agency and reflects the emissions limits set out in the Industrial Emissions Directive.
The graph shows the level of permissible emissions according to the Environmental Permit, shown by the yellow line. The actual emissions produced by the facility are shown in green as a percentage average output over the month. For this month, all emissions produced are below the permitted limit set by the Environment Agency and our Permit.

June 2023 emissions monitoring
The Gloucestershire Energy from Waste Facility has published the emissions monitoring results for operational activity during June 2023.
The emissions levels are set out in the facility’s Environmental Permit that was issued by the Environment Agency and reflects the emissions limits set out in the Industrial Emissions Directive.
The graph shows the level of permissible emissions according to the Environmental Permit, shown by the yellow line. The actual emissions produced by the facility are shown in green as a percentage average output over the month. For this month, all emissions produced are below the permitted limit set by the Environment Agency and our Permit.

May 2023 emissions monitoring
The Gloucestershire Energy from Waste Facility has published the emissions monitoring results for operational activity during May 2023.
The emissions levels are set out in the facility’s Environmental Permit that was issued by the Environment Agency and reflects the emissions limits set out in the Industrial Emissions Directive.
The graph shows the level of permissible emissions according to the Environmental Permit, shown by the yellow line. The actual emissions produced by the facility are shown in green as a percentage average output over the month. For this month, all emissions produced are below the permitted limit set by the Environment Agency and our Permit.

April 2023 emissions monitoring
The Gloucestershire Energy from Waste Facility has published the emissions monitoring results for operational activity during April 2023.
The emissions levels are set out in the facility’s Environmental Permit that was issued by the Environment Agency and reflects the emissions limits set out in the Industrial Emissions Directive.
The graph shows the level of permissible emissions according to the Environmental Permit, shown by the yellow line. The actual emissions produced by the facility are shown in green as a percentage average output over the month. For this month, all emissions produced are below the permitted limit set by the Environment Agency and our Permit.

March 2023 emissions monitoring
The Gloucestershire Energy from Waste Facility has published the emissions monitoring results for operational activity during March 2023.
The emissions levels are set out in the facility’s Environmental Permit that was issued by the Environment Agency and reflects the emissions limits set out in the Industrial Emissions Directive.
The graph shows the level of permissible emissions according to the Environmental Permit, shown by the yellow line. The actual emissions produced by the facility are shown in green as a percentage average output over the month. For this month, all emissions produced are below the permitted limit set by the Environment Agency and our Permit.

February 2023 emissions monitoring
The Gloucestershire Energy from Waste Facility has published the emissions monitoring results for operational activity during February 2023.
The emissions levels are set out in the facility’s Environmental Permit that was issued by the Environment Agency and reflects the emissions limits set out in the Industrial Emissions Directive.
The graph shows the level of permissible emissions according to the Environmental Permit, shown by the yellow line. The actual emissions produced by the facility are shown in green as a percentage average output over the month. For this month, all emissions produced are below the permitted limit set by the Environment Agency and our Permit.

January 2023 emissions monitoring
The Gloucestershire Energy from Waste Facility has published the emissions monitoring results for operational activity during January 2023.
The emissions levels are set out in the facility’s Environmental Permit that was issued by the Environment Agency and reflects the emissions limits set out in the Industrial Emissions Directive.
The graph shows the level of permissible emissions according to the Environmental Permit, shown by the yellow line. The actual emissions produced by the facility are shown in green as a percentage average output over the month. For this month, all emissions produced are below the permitted limit set by the Environment Agency and our Permit.

December 2022 emissions monitoring
The Gloucestershire Energy from Waste Facility has published the emissions monitoring results for operational activity during December 2022.
The emissions levels are set out in the facility’s Environmental Permit that was issued by the Environment Agency and reflects the emissions limits set out in the Industrial Emissions Directive.
The graph shows the level of permissible emissions according to the Environmental Permit, shown by the yellow line. The actual emissions produced by the facility are shown in green as a percentage average output over the month. For this month, all emissions produced are below the permitted limit set by the Environment Agency and our Permit.

November 2022 emissions monitoring
The Gloucestershire Energy from Waste Facility has published the emissions monitoring results for operational activity during November 2022.
The emissions levels are set out in the facility’s Environmental Permit that was issued by the Environment Agency and reflects the emissions limits set out in the Industrial Emissions Directive.
The graph shows the level of permissible emissions according to the Environmental Permit, shown by the yellow line. The actual emissions produced by the facility are shown in green as a percentage average output over the month. For this month, all emissions produced are below the permitted limit set by the Environment Agency and our Permit.

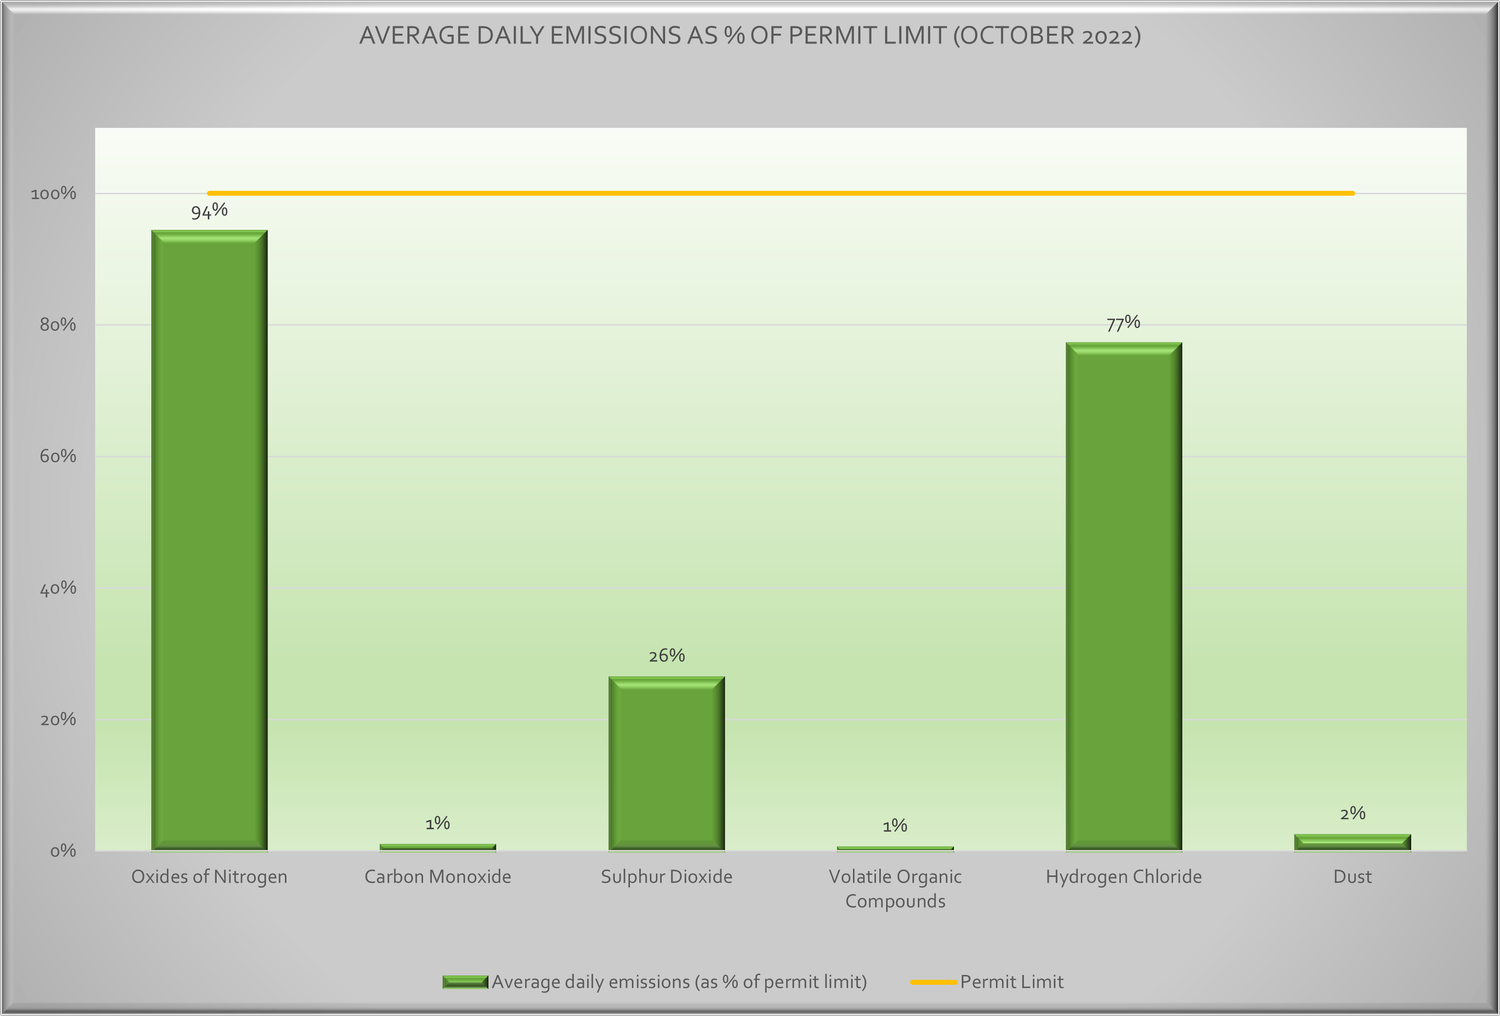
October 2022 emissions monitoring
The Gloucestershire Energy from Waste Facility has published the emissions monitoring results for operational activity during October 2022.
The emissions levels are set out in the facility’s Environmental Permit that was issued by the Environment Agency and reflects the emissions limits set out in the Industrial Emissions Directive.
The graph shows the level of permissible emissions according to the Environmental Permit, shown by the yellow line. The actual emissions produced by the facility are shown in green as a percentage average output over the month. For this month, all emissions produced are below the permitted limit set by the Environment Agency and our Permit.
September 2022 emissions monitoring
The Gloucestershire Energy from Waste Facility has published the emissions monitoring results for operational activity during September 2022.
The emissions levels are set out in the facility’s Environmental Permit that was issued by the Environment Agency and reflects the emissions limits set out in the Industrial Emissions Directive.
The graph shows the level of permissible emissions according to the Environmental Permit, shown by the yellow line. The actual emissions produced by the facility are shown in green as a percentage average output over the month. For this month, all emissions produced are below the permitted limit set by the Environment Agency and our Permit.

August 2022 emissions monitoring
The Gloucestershire Energy from Waste Facility has published the emissions monitoring results for operational activity during August 2022.
The emissions levels are set out in the facility’s Environmental Permit that was issued by the Environment Agency and reflects the emissions limits set out in the Industrial Emissions Directive.
The graph shows the level of permissible emissions according to the Environmental Permit, shown by the yellow line. The actual emissions produced by the facility are shown in green as a percentage average output over the month. For this month, all emissions produced are below the permitted limit set by the Environment Agency and our Permit.

July 2022 emissions monitoring
The Gloucestershire Energy from Waste Facility has published the emissions monitoring results for operational activity during July 2022.
The emissions levels are set out in the facility’s Environmental Permit that was issued by the Environment Agency and reflects the emissions limits set out in the Industrial Emissions Directive.
The graph shows the level of permissible emissions according to the Environmental Permit, shown by the yellow line. The actual emissions produced by the facility are shown in green as a percentage average output over the month. For this month, all emissions produced are below the permitted limit set by the Environment Agency and our Permit.

June 2022 emissions monitoring
The Gloucestershire Energy from Waste Facility has published the emissions monitoring results for operational activity during June 2022.
The emissions levels are set out in the facility’s Environmental Permit that was issued by the Environment Agency and reflects the emissions limits set out in the Industrial Emissions Directive.
The graph shows the level of permissible emissions according to the Environmental Permit, shown by the yellow line. The actual emissions produced by the facility are shown in green as a percentage average output over the month. For this month, all emissions produced are below the permitted limit set by the Environment Agency and our Permit.

May 2022 emissions monitoring
The Gloucestershire Energy from Waste Facility has published the emissions monitoring results for operational activity during May 2022.
The emissions levels are set out in the facility’s Environmental Permit that was issued by the Environment Agency and reflects the emissions limits set out in the Industrial Emissions Directive.
The graph shows the level of permissible emissions according to the Environmental Permit, shown by the yellow line. The actual emissions produced by the facility are shown in green as a percentage average output over the month. For this month, all emissions produced are below the permitted limit set by the Environment Agency and our Permit.

April 2022 emissions monitoring
The Gloucestershire Energy from Waste Facility has published the emissions monitoring results for operational activity during April 2022.
The emissions levels are set out in the facility’s Environmental Permit that was issued by the Environment Agency and reflects the emissions limits set out in the Industrial Emissions Directive.
The graph shows the level of permissible emissions according to the Environmental Permit, shown by the yellow line. The actual emissions produced by the facility are shown in green as a percentage average output over the month. For this month, all emissions produced are below the permitted limit set by the Environment Agency and our Permit.

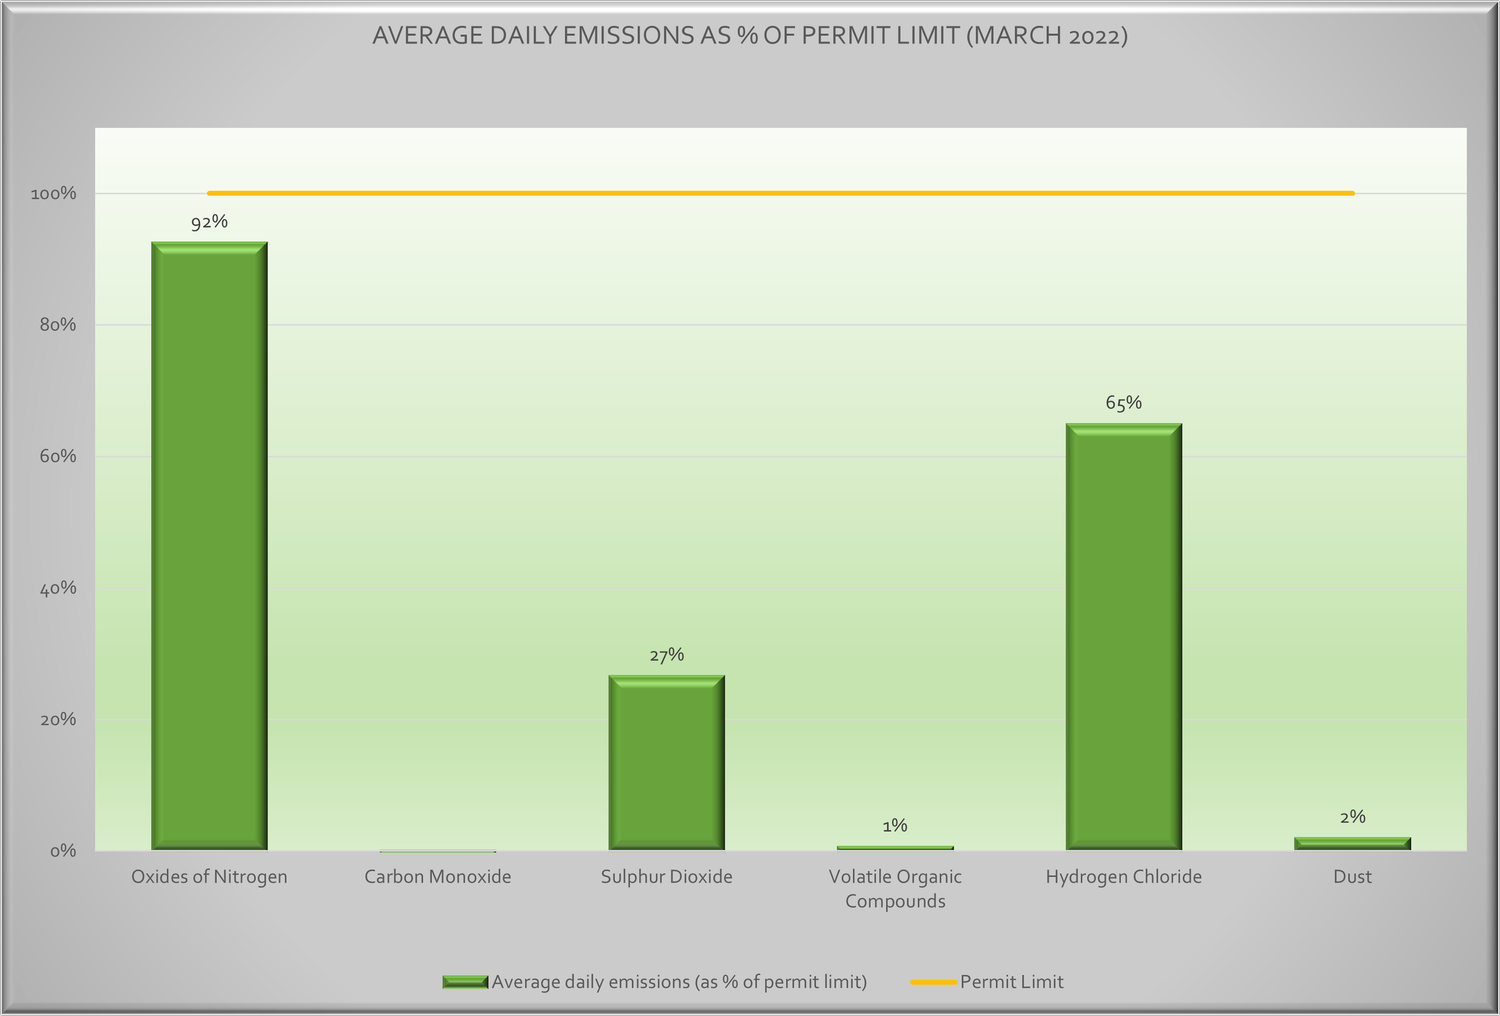
March 2022 emissions monitoring
The Gloucestershire Energy from Waste Facility has published the emissions monitoring results for operational activity during February 2022.
The emissions levels are set out in the facility’s Environmental Permit that was issued by the Environment Agency and reflects the emissions limits set out in the Industrial Emissions Directive.
The graph shows the level of permissible emissions according to the Environmental Permit, shown by the yellow line. The actual emissions produced by the facility are shown in green as a percentage average output over the month. For this month, all emissions produced are below the permitted limit set by the Environment Agency and our Permit.
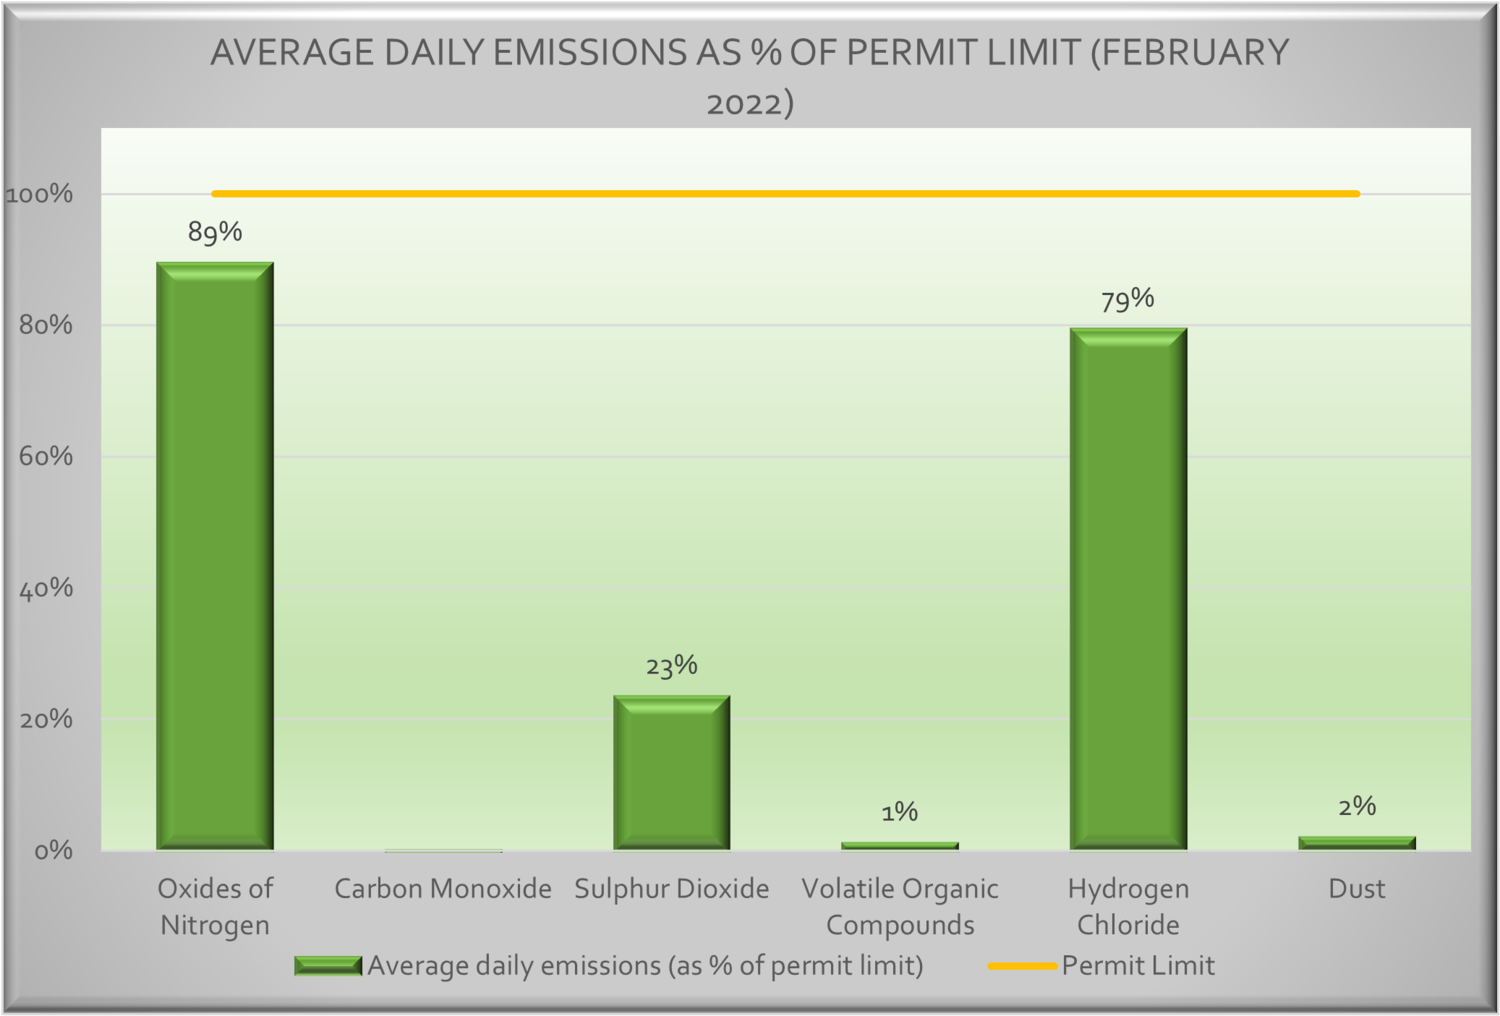
February 2022 emissions monitoring
The Gloucestershire Energy from Waste Facility has published the emissions monitoring results for operational activity during February 2022.
The emissions levels are set out in the facility’s Environmental Permit that was issued by the Environment Agency and reflects the emissions limits set out in the Industrial Emissions Directive.
The graph shows the level of permissible emissions according to the Environmental Permit, shown by the yellow line. The actual emissions produced by the facility are shown in green as a percentage average output over the month. For this month, all emissions produced are below the permitted limit set by the Environment Agency and our Permit.
January 2022 emissions monitoring
The Gloucestershire Energy from Waste Facility has published the emissions monitoring results for operational activity during January 2022.
The emissions levels are set out in the facility’s Environmental Permit that was issued by the Environment Agency and reflects the emissions limits set out in the Industrial Emissions Directive.
The graph shows the level of permissible emissions according to the Environmental Permit, shown by the yellow line. The actual emissions produced by the facility are shown in green as a percentage average output over the month. For this month, all emissions produced are below the permitted limit set by the Environment Agency and our Permit.

December 2021 emissions monitoring
The Gloucestershire Energy from Waste Facility has published the emissions monitoring results for operational activity during December 2021.
The emissions levels are set out in the facility’s Environmental Permit that was issued by the Environment Agency and reflects the emissions limits set out in the Industrial Emissions Directive.
The graph shows the level of permissible emissions according to the Environmental Permit, shown by the yellow line. The actual emissions produced by the facility are shown in green as a percentage average output over the month. For this month, all emissions produced are below the permitted limit set by the Environment Agency and our Permit.

November 2021 emissions monitoring
The Gloucestershire Energy from Waste Facility has published the emissions monitoring results for operational activity during November 2021.
The emissions levels are set out in the facility’s Environmental Permit that was issued by the Environment Agency and reflects the emissions limits set out in the Industrial Emissions Directive.
The graph shows the level of permissible emissions according to the Environmental Permit, shown by the yellow line. The actual emissions produced by the facility are shown in green as a percentage average output over the month. For this month, all emissions produced are below the permitted limit set by the Environment Agency and our Permit.

October 2021 emissions monitoring
The Gloucestershire Energy from Waste Facility has published the emissions monitoring results for operational activity during October 2021.
The emissions levels are set out in the facility’s Environmental Permit that was issued by the Environment Agency and reflects the emissions limits set out in the Industrial Emissions Directive.
The graph shows the level of permissible emissions according to the Environmental Permit, shown by the yellow line. The actual emissions produced by the facility are shown in green as a percentage average output over the month. For this month, all emissions produced are below the permitted limit set by the Environment Agency and our Permit.

September 2021 emissions monitoring
The Gloucestershire Energy from Waste Facility has published the emissions monitoring results for operational activity during September 2021.
The emissions levels are set out in the facility’s Environmental Permit that was issued by the Environment Agency and reflects the emissions limits set out in the Industrial Emissions Directive.
The graph shows the level of permissible emissions according to the Environmental Permit, shown by an orange line. The actual emissions produced by the facility are shown in green as a percentage average output over the month. For this month, all emissions produced are below the permitted limit set by the Environment Agency and our permit.

August 2021 emissions monitoring
The Gloucestershire Energy from Waste Facility has published the emissions monitoring results for operational activity during August 2021.
The emissions levels are set out in the facility’s Environmental Permit that was issued by the Environment Agency and reflects the emissions limits set out in the Industrial Emissions Directive.
The graph shows the level of permissible emissions according to the Environmental Permit, shown by an orange line. The actual emissions produced by the facility are shown in green as a percentage average output over the month. For this month, all emissions produced are below the permitted limit set by the Environment Agency and our permit.

July 2021 emissions monitoring
The Gloucestershire Energy from Waste Facility has published the emissions monitoring results for operational activity during July 2021.
The emissions levels are set out in the facility’s Environmental Permit that was issued by the Environment Agency and reflects the emissions limits set out in the Industrial Emissions Directive.
The graph shows the level of permissible emissions according to the Environmental Permit, shown by an orange line. The actual emissions produced by the facility are shown in green as a percentage average output over the month. For this month, all emissions produced are below the permitted limit set by the Environment Agency and our permit.

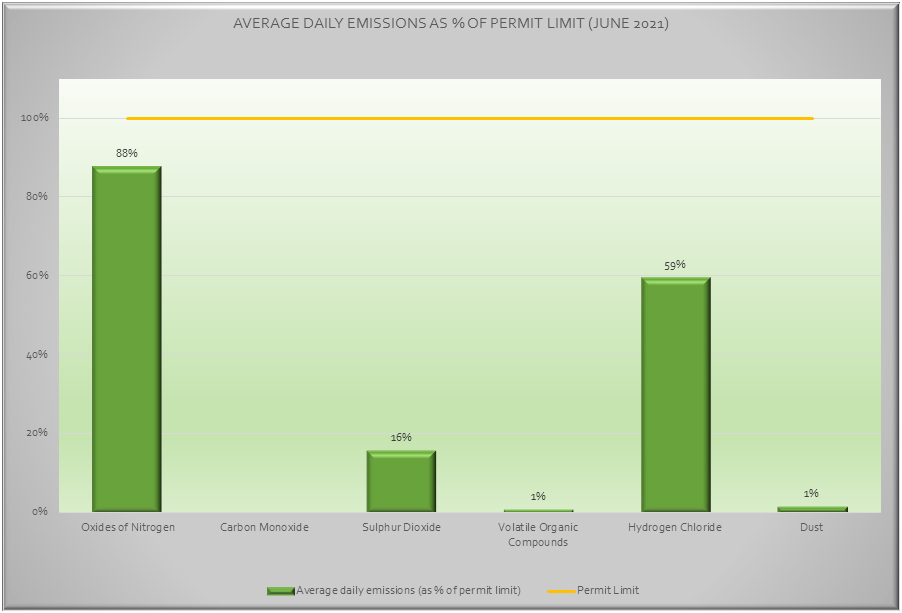
June 2021 emissions monitoring
The Gloucestershire Energy from Waste Facility has published the emissions monitoring results for operational activity during June 2021.
The emissions levels are set out in the facility’s Environmental Permit that was issued by the Environment Agency and reflects the emissions limits set out in the Industrial Emissions Directive.
The graph shows the level of permissible emissions according to the Environmental Permit, shown by an orange line. The actual emissions produced by the facility are shown in green as a percentage average output over the month. For this month, all emissions produced are below the permitted limit set by the Environment Agency and our permit.
May 2021 emissions monitoring
The Gloucestershire Energy from Waste Facility has published the emissions monitoring results for operational activity during May 2021.
The emissions levels are set out in the facility’s Environmental Permit that was issued by the Environment Agency and reflects the emissions limits set out in the Industrial Emissions Directive.
The graph shows the level of permissible emissions according to the Environmental Permit, shown by an orange line. The actual emissions produced by the facility are shown in green as a percentage average output over the month. For this month, all emissions produced are below the permitted limit set by the Environment Agency and our permit.

April 2021 emissions monitoring
The Gloucestershire Energy from Waste Facility has published the emissions monitoring results for operational activity during April 2021.
The emissions levels are set out in the facility’s Environmental Permit that was issued by the Environment Agency and reflects the emissions limits set out in the Industrial Emissions Directive.
The graph shows the level of permissible emissions according to the Environmental Permit, shown by an orange line. The actual emissions produced by the facility are shown in green as a percentage average output over the month. For this month, all emissions produced are below the permitted limit set by the Environment Agency and our permit.

March 2021 emissions monitoring
The Gloucestershire Energy from Waste Facility has published the emissions monitoring results for operational activity during March 2021.
The emissions levels are set out in the facility’s Environmental Permit that was issued by the Environment Agency and reflects the emissions limits set out in the Industrial Emissions Directive.
The graph shows the level of permissible emissions according to the Environmental Permit, shown by an orange line. The actual emissions produced by the facility are shown in green as a percentage average output over the month. For this month, all emissions produced are below the permitted limit set by the Environment Agency and our permit.

February 2021 emissions monitoring
The Gloucestershire Energy from Waste Facility has published the emissions monitoring results for operational activity during February 2021.
The emissions levels are set out in the facility’s Environmental Permit that was issued by the Environment Agency and reflects the emissions limits set out in the Industrial Emissions Directive.
The graph shows the level of permissible emissions according to the Environmental Permit, shown by an orange line. The actual emissions produced by the facility are shown in green as a percentage average output over the month. For this month, all emissions produced are below the permitted limit set by the Environment Agency and our permit.

January 2021 emissions monitoring
The Gloucestershire Energy from Waste Facility has published the emissions monitoring results for operational activity during January 2021.
The emissions levels are set out in the facility’s Environmental Permit that was issued by the Environment Agency and reflects the emissions limits set out in the Industrial Emissions Directive.
The graph shows the level of permissible emissions according to the Environmental Permit, shown by an orange line. The actual emissions produced by the facility are shown in green as a percentage average output over the month. For this month, all emissions produced are below the permitted limit set by the Environment Agency and our permit.

December 2020 emissions monitoring
The Gloucestershire Energy from Waste Facility has published the emissions monitoring results for operational activity during December 2020.
The emissions levels are set out in the facility’s Environmental Permit that was issued by the Environment Agency and reflects the emissions limits set out in the Industrial Emissions Directive.
The graph shows the level of permissible emissions according to the Environmental Permit, shown by an orange line. The actual emissions produced by the facility are shown in green as a percentage average output over the month. For this month, all emissions produced are below the permitted limit set by the Environment Agency and our permit.

November 2020 emissions monitoring
The Gloucestershire Energy from Waste Facility has published the emissions monitoring results for operational activity during November 2020.
The emissions levels are set out in the facility’s Environmental Permit that was issued by the Environment Agency and reflects the emissions limits set out in the Industrial Emissions Directive.
The graph shows the level of permissible emissions according to the Environmental Permit, shown by an orange line. The actual emissions produced by the facility are shown in green as a percentage average output over the month. For this month, all emissions produced are below the permitted limit set by the Environment Agency and our permit.

October 2020 emissions monitoring
The Gloucestershire Energy from Waste Facility has published the emissions monitoring results for operational activity during October 2020.
The emissions levels are set out in the facility’s Environmental Permit that was issued by the Environment Agency and reflects the emissions limits set out in the Industrial Emissions Directive.
The graph shows the level of permissible emissions according to the Environmental Permit, shown by an orange line. The actual emissions produced by the facility are shown in green as a percentage average output over the month. For this month, all emissions produced are below the permitted limit set by the Environment Agency and our permit.

September 2020 emissions monitoring
The Gloucestershire Energy from Waste Facility has published the emissions monitoring results for operational activity during September 2020.
The emissions levels are set out in the facility’s Environmental Permit that was issued by the Environment Agency and reflects the emissions limits set out in the Industrial Emissions Directive.
The graph shows the level of permissible emissions according to the Environmental Permit, shown by an orange line. The actual emissions produced by the facility are shown in green as a percentage average output over the month. For this month, all emissions produced are below the permitted limit set by the Environment Agency and our permit.

August 2020 emissions monitoring
The Gloucestershire Energy from Waste Facility has published the emissions monitoring results for operational activity during August 2020.
The emissions levels are set out in the facility’s Environmental Permit that was issued by the Environment Agency and reflects the emissions limits set out in the Industrial Emissions Directive.
The graph shows the level of permissible emissions according to the Environmental Permit, shown by an orange line. The actual emissions produced by the facility are shown in green as a percentage average output over the month. For this month, all emissions produced are below the permitted limit set by the Environment Agency and our permit.

July 2020 emissions monitoring
The Gloucestershire Energy from Waste Facility has published the emissions monitoring results for operational activity during July 2020.
The emissions levels are set out in the facility’s Environmental Permit that was issued by the Environment Agency and reflects the emissions limits set out in the Industrial Emissions Directive.
The graph shows the level of permissible emissions according to the Environmental Permit, shown by an orange line. The actual emissions produced by the facility are shown in green as a percentage average output over the month. For this month, all emissions produced are below the permitted limit set by the Environment Agency and our permit.

June 2020 emissions monitoring
The Gloucestershire Energy from Waste Facility has published the emissions monitoring results for operational activity during June 2020.
The emissions levels are set out in the facility’s Environmental Permit that was issued by the Environment Agency and reflects the emissions limits set out in the Industrial Emissions Directive.
The graph shows the level of permissible emissions according to the Environmental Permit, shown by an orange line. The actual emissions produced by the facility are shown in green as a percentage average output over the month. For this month, all emissions produced are below the permitted limit set by the Environment Agency and our permit.

May 2020 emissions monitoring
The Gloucestershire Energy from Waste Facility has published the emissions monitoring results for operational activity during May 2020.
The emissions levels are set out in the facility’s Environmental Permit that was issued by the Environment Agency and reflects the emissions limits set out in the Industrial Emissions Directive.
The graph shows the level of permissible emissions according to the Environmental Permit, shown by an orange line. The actual emissions produced by the facility are shown in green as a percentage average output over the month. For this month, all emissions produced are below the permitted limit set by the Environment Agency and our permit.

April 2020 emissions monitoring
The Gloucestershire Energy from Waste Facility has published the emissions monitoring results for operational activity during April 2020.
The emissions levels are set out in the facility’s Environmental Permit that was issued by the Environment Agency and reflects the emissions limits set out in the Industrial Emissions Directive.
The graph shows the level of permissible emissions according to the Environmental Permit, shown by an orange line. The actual emissions produced by the facility are shown in green as a percentage average output over the month. For this month, all emissions produced are below the permitted limit set by the Environment Agency and our permit.

March 2020 emissions monitoring
The Gloucestershire Energy from Waste Facility has published the emissions monitoring results for operational activity during March 2020.
The emissions levels are set out in the facility’s Environmental Permit that was issued by the Environment Agency and reflects the emissions limits set out in the Industrial Emissions Directive.
The graph shows the level of permissible emissions according to the Environmental Permit, shown by an orange line. The actual emissions produced by the facility are shown in green as a percentage average output over the month. For this month, all emissions produced are below the permitted limit set by the Environment Agency and our permit.

February 2020 emissions monitoring
The Gloucestershire Energy from Waste Facility has published the emissions monitoring results for operational activity during February 2020.
The emissions levels are set out in the facility’s Environmental Permit that was issued by the Environment Agency and reflects the emissions limits set out in the Industrial Emissions Directive.
The graph shows the level of permissible emissions according to the Environmental Permit, shown by an orange line. The actual emissions produced by the facility are shown in green as a percentage average output over the month. For this month, all emissions produced are below the permitted limit set by the Environment Agency and our permit.

January 2020 emissions monitoring
The Gloucestershire Energy from Waste Facility has published the emissions monitoring results for operational activity during January 2020.
The emissions levels are set out in the facility’s Environmental Permit that was issued by the Environment Agency and reflects the emissions limits set out in the Industrial Emissions Directive.
The graph shows the level of permissible emissions according to the Environmental Permit, shown by an orange line. The actual emissions produced by the facility are shown in green as a percentage average output over the month. For this month, all emissions produced are below the permitted limit set by the Environment Agency and our permit.

December 2019 emissions monitoring
The Gloucestershire Energy from Waste Facility has published the emissions monitoring results for operational activity during December 2019.
The emissions levels are set out in the facility’s Environmental Permit that was issued by the Environment Agency and reflects the emissions limits set out in the Industrial Emissions Directive.
The graph shows the level of permissible emissions according to the Environmental Permit, shown by an orange line. The actual emissions produced by the facility are shown in green as a percentage average output over the month. For this month, all emissions produced are below the permitted limit set by the Environment Agency and our permit.

